ARGUS + Analytics
Argus and Analytics
Argus is a network activity logging facility, generating status reports on the existence, and status of network transactions. This data is modeled after the telco voice system's Call Detail Record, which has been used by the telcos to support a huge number of management operations, including security, operations and performance management. As a result, argus data has security, operations and performance metrics embedded in its data model to support these efforts.
Analytics can be very simple, such as the count of TCP connections seen in a day, or the maximum bandwidth seen in any HTTP request, or total bytes transmitted, or the total number of IPv4 and IPv6 addresses access by this server.
Analytics can also be complex, such as is this network connection different from what we expect, is this network traffic allowed, or what is the likelihood of this network relationship being a threat to an organization.
From a security perspective, having a comprehensive network log of all the activity of a network link, or even a single host, is huge, as it enables post incident network forensics analysis, so you can figure out answers to " what went wrong ", " when did they start ", " how did they get in ", " are they still around ", " is it a machine or a person " or " how bad is it " ????
But having a lot of network history enables you to understand normal behavior, whether you're a security person, or a network operations person. What is normal can help you to understand if things are ok, and what you can expect.
If the data is well developed, you should be able to do the kinds of things that the telcos have been doing with their CDRs. Establish baselines of network usage, characterize the services being used, account for network failures, charge back for network use, troubleshoot poor connectivity, etc ...
The existing argus-client programs provide the basic foundation for answering these questions, and more. Historical projects have centered around visualizations of network activity, social network analysis of network matrix data, scan detection, lateral movement detection, etc ...
Aggregation
Argus data aggregation is the basis of a complete family of Argus analytics. Raw argus data is a type of quantum of network activity data, the proto data element if you will. Most analytics will involve merging / aggregating raw argus data into a set of datasets that best represent the data needed to perform the statistical analysis.
Building a list of active IP addresses in the network for a specific time range and reporting on, say, peak bandwidth utilization, involves aggregating all the data in the time range, in a way that preserves one of the addresses in the records and accumulates the metrics. While it is rather complicated, as argus has a lot of identifiers, metrics and attributes which need their own methods, the tools are available to make it pretty easy.
The open source project is working on optimizing its set of aggregation methods as well as creating new ones.
Visualization
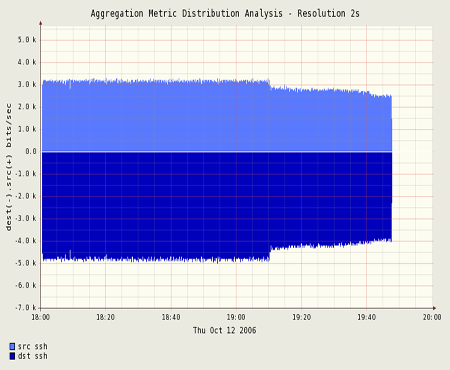
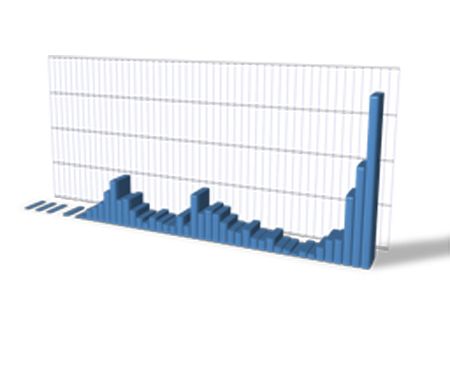
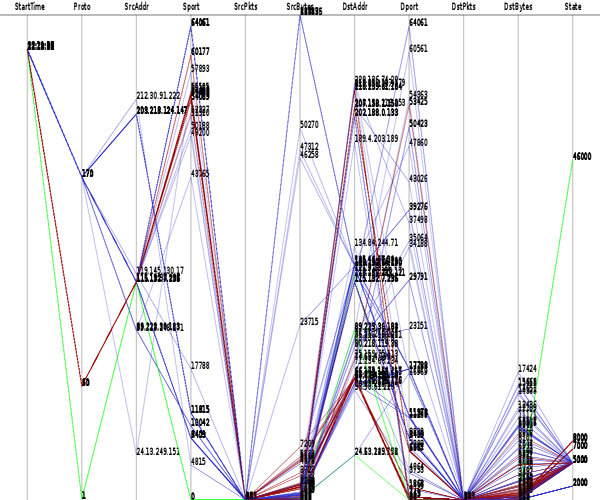
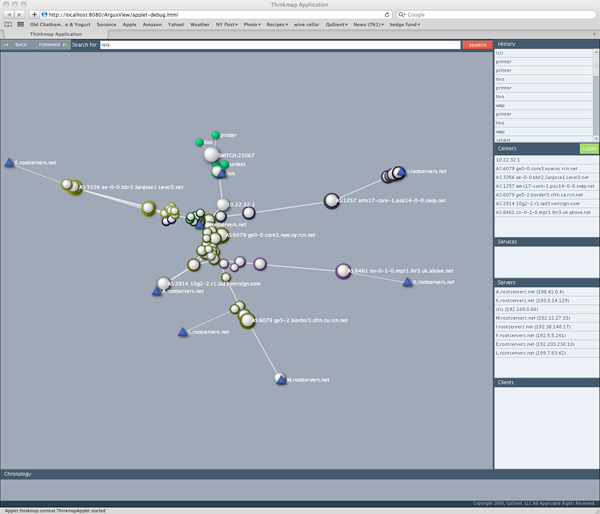
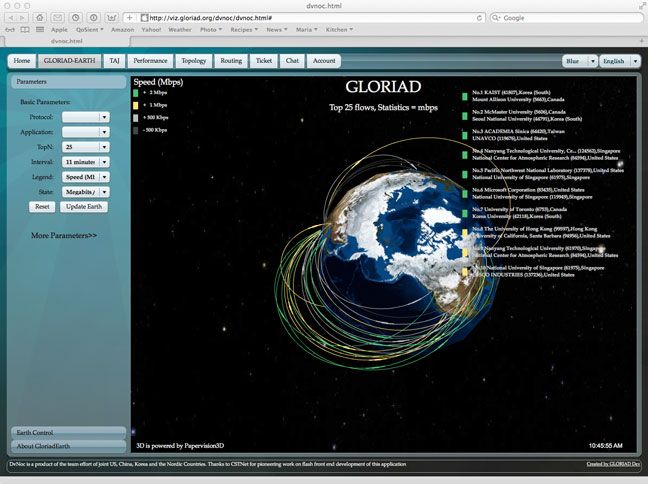
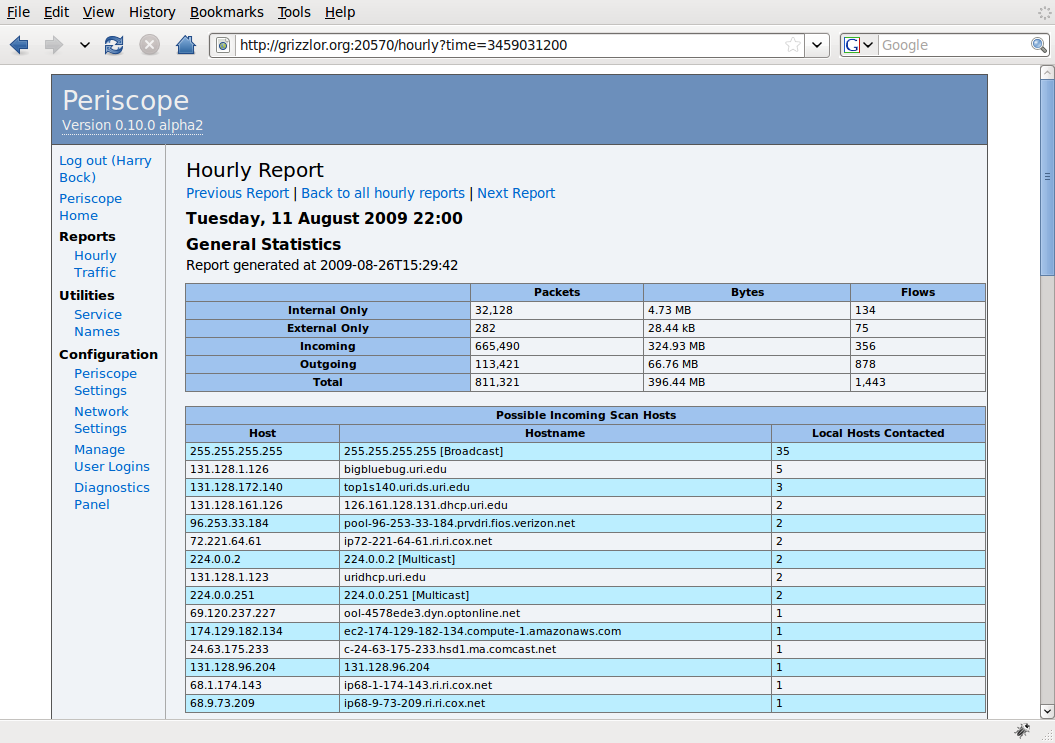
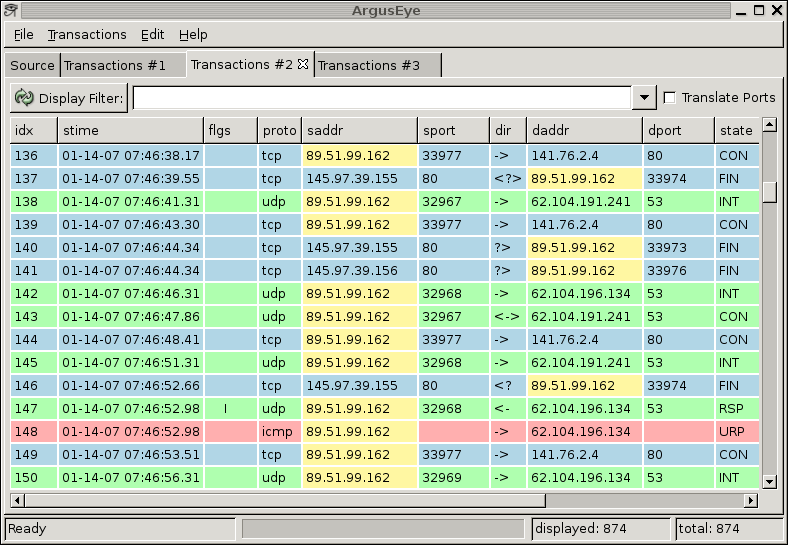
There are a lot of topics to present here. These images are links to efforts that use argus data for visualization. Some are references to other web-sites and other projects, so you may wind up somewhere else in the Internet, but hopefully you will find it interesting. Not all of the references are to "active" projects, but as long as the links are working, all do refer to code that is available for implemenation, or are descriptive enough to provide a good example as to what/how people are visualization argus data.
This page is in no way "complete", and more work is coming in the next months. But, please send any suggestions for additional images, and HOW-TO's for graphing and do send any links that have visualizations that you created using argus data.
Each of the pages should be somewhat descriptive.

